But first a brief summary of claims I've already debunked:
1. The mid-twentieth century hiatus in global temperatures can be explained by the cooling efffect of industrial aerosols (see the second post in this series).
2. Sea level rise isn't correlated with CO2 emissions, because, according to blogger CCHolley, it's "highly variable about the mean level due to the hydrological cycle," and besides "sea level rise correlating to temperatures has nothing to do with the cause of the temperature rise," and besides "perfect correlation to temperature would not be expected because ice will not stop melting just because warming stopped, it takes time for the ice to reach thermal equilibrium. . ." -- none of which has the slightest bearing on the fact that it's impossible to claim a cause-effect relation if no correlation exists, for whatever reason (see also the third post in this series.)
3. Evidence that sea level rise has actually declined over the last several years can be explained by the cooling effects of the Mt. Pinatubo eruption, which masked the expected accelaration (see the previous post in this series).
Now for some more examples:
The ocean ate my global warming
The notorious "hiatus" in global temperatures during the first 15 years or so of the 21st century is due to so much of the heat somehow winding up in the ocean.
Response: as far as I can tell, no evidence has been offered as to why all that heat would suddenly be diverted to the ocean after 20 years of heating the atmosphere.
Moreover,
The cold waters of Earth’s deep ocean have not warmed measurably since 2005, . . . leaving unsolved the mystery of why global warming appears to have slowed in recent years. Scientists at NASA’s Jet Propulsion Laboratory (JPL) in Pasadena, California, analyzed satellite and direct ocean temperature data from 2005 to 2013 and found the ocean abyss below 1.24 miles (1,995 meters) has not warmed measurably. . . . [see Deep-ocean contribution to sea level and energy budget not detectable over the past decade, by Llovel, Willis, et al.]Also, from a Scientific American article responding to the same study:
Sea surface temperatures over the last decade have essentially been at a standstill, which is a problem, since the ocean warms from the top down. So, it would appear, global warming has “paused.”All those record breaking temperatures prove the "hiatus" is a myth.
Consider the following graph (from Spencer Weart, The Modern Temperature Trend ):
The "hiatus" is a myth -- just look at the latest trend line
As we can see from the following graph, from the Skeptical Science trend calculator, temperatures peaked rather dramatically in 2016 (based on RSSv4.0 TTT) :

And as one might expect, proponents of the "consensus" view have pointed to the very clear upward trend so evident here, supposedly illustrating that the so-called "hiatus" was merely a temporary blip.
Not so fast. Here's a graph from the same source, of global temperatures from 1998 through 2014:

So what are we to think? As skeptics see it, the 2016 spike is an outlier, based solely on an unusually intense El Nino, and can safely be ignored as atypical. As climate change advocates see it, 2016 represents what they've been waiting for, the resumption of global heating after a 15 year period of "noise," and is therefore perfectly valid as evidence. Each side then accuses the other of "cherry picking" by selecting end points that support the favored theory. As I see it, what the discrepancy illustrates is the fact that statistics per se can be an unreliable basis for evaluating certain types of hypothesis. As should be evident, the calculated trend means little if we get significantly different results when different endpoints are selected.
While "eyeballing" a graph has been condemned by some as "unscientific," it is in fact far superior in evaluating linear data than a statistical analysis based on arbitrarily selected elements. When we simply examine the most complete (topmost) graph by eye, the picture becomes quite clear: regardless of any "trend line" produced by a statistical analysis, if these figures are accurate then we see little evidence of any meaningful correlation between CO2 emissions, which soared during this period, and global temperatures, which seem to have either remained level or fallen for almost the entire extent of the graph. The sudden upward shift at the tail is hardly sufficient to make up for roughly 15 years of little or no warming. And as we know, the notion that 15 years can be discounted as "noise" in comparison with the claimed "long term" correlation between global warming and CO2 during the period preceding it, is simply a bluff, since, as I've already demonstrated, there was never any such thing.
The recent data "corrections," as published by Karl et al. demonstrate that there was never any hiatus in the first place. In fact, "as we now know," global temperatures have been steadily rising throughout the 21st century in a manner consistent with the steep rise noted during the last years of the 20th.
Even a cursory examination of the paper in question (titled, revealingly, "Climate-change ‘hiatus’ disappears with new data") reveals the enormous difficulties involved in assessing global sea and land temperatures in the first place. Karl and his associates compile a long list of dubious practices and confounding inconsistencies involved in gathering temperature data from a host of different sources over long periods of time. Many of their attempts to "correct" this highly questionable data seem suspiciously arbitrary, and one cannot help but surmise that a different team might well have come up with a totally different approach, resulting in a totally different conclusion.
What these researchers appear to have demonstrated is not so much the "disappearance" of the hiatus as the utter futility of any attempt to accurately assess global temperatures at all, at any time, and by any means. Regardless, any effort to reassess long accepted data in such a drastic manner sets an unfortunate precedent, since we have no way of knowing what future corrections along similar lines might produce at some future date, possibly leading to very different conclusions. As suggested by the paper's title, it looks very much like the authors were committed from the start to coming up with results that would make the thorny "hiatus" go away.
Since Karl has been an outspoken advocate of AGW for some time, it's not difficult to see this effort as yet another "saving hypothesis" of the type we've already encountered, though more intensively researched than most. Confirmation bias is an ever present danger in all types of scientific research, even with the best of intentions, and as is well known, even the most careful researchers have been known to skew their results to favor a desired outcome. A reassessment of this sort would be a lot more convincing had it been conducted by a totally independent, unbiased team with no ax to grind.
What should be of greatest concern to all the many climate scientists who have worked so hard to explain away the hiatus in the past, is the realization that the new corrections not only render their efforts superfluous, but reveal the confirmation bias at work in their own research, since, if Karl's team is right, their conclusions were based on faulty data to begin with, which nevertheless provided them with the results they desired.
The skeptics must be wrong, because so much of the evidence bears the unmistakable signature of AGW: the stratosphere is cooling; arctic sea ice is dwindling; extreme weather events have become more common.
Stratosphere
As reported at the SkepticalScience website, "Another human fingerprint can be found by looking at temperature trends in the different layers of the atmosphere. Climate models predict that more carbon dioxide should cause warming in the troposphere but cooling in the stratosphere. This is because the increased "blanketing" effect in the troposphere holds in more heat, allowing less to reach the stratosphere." Unfortunately for the models, stratospheric temperatures have remained relatively stable over the last 22 years: "until about 1995 the stratospheric temperature record shows a persistent decline, ascribed by some scientists to the effect of more and more heat being trapped by CO2 in the troposphere below. However, this temperature decline ends around 1995–96, and a long temperature plateau has since then characterised the stratosphere." (from State of the Climate 2917, Ole Humlum). Graph courtesy of NOAA:

Arctic Ice
While it is true that Arctic ice extent has been dwindling for some time, Antarctic ice extent has been growing:

(graph from State of the Climate 2917, Ole Humlum) "Figure 34 shows 12-month average sea-ice extents for the Arctic and Antarctic. The trends are in opposite directions. The modern Northern Hemisphere trend towards smaller sea-ice extent is clearly displayed by the blue graph, and so is the trend towards a simultaneous increase of Southern Hemisphere sea ice extent." (Ibid.) The very recent, rather drastic, decrease in Antarctic ice can be attributed to the exceptionally strong El Nino of 2016, but the overall upward trend is clear.
-----------------------------------------------------------
Extreme Events
To read most major media outlets, both online and off, we have entered an increasingly dangerous if not disastrous period of human history, the "anthropocene," in which extreme weather events, such as floods, storms, droughts, etc. have become "the new normal." "Isn't it obvious?" Can't we see it on television with our own eyes, all those floods, all the tornadoes, hurricanes, extremes of hot and cold?
According to Roger Pielke, whose research on the topic is both widely known and, in some quarters, extremely controversial, "There is scant evidence to indicate that hurricanes, floods, tornadoes or drought have become more frequent or intense in the U.S. or globally. In fact we are in an era of good fortune when it comes to extreme weather."
Heat Waves
If you prefer not to take Pielke at his word, then consider the following evidence on heat waves, courtesy of the EPA:

----------------------------------------------------------
Droughts
THE world has been suffering more droughts in recent decades, and climate change will bring many more, according to received wisdom. Now it is being challenged by an analysis that questions a key index on which it is based.
Predictions of megadroughts affecting Africa and the western side of North America may be wrong. We could even be headed for wetter times, says Justin Sheffield of Princeton University.
------------------------------------------------------------------------------------------------------------This potential handbrake turn for climate forecasts hangs on the accuracy of our main measure of drought, the Palmer Drought Severity Index. The Intergovernmental Panel on Climate Change’s 2007 science assessment cited studies using the PDSI to conclude that “droughts have become more common since the 1970s” as the world has warmed – a position we take to be true in this week’s cover story (see “Climate downgrade: Arctic warming“). The report predicted droughts will increase with global warming.
The problem with the PDSI, says Sheffield, is that it does not directly measure drought. Instead, it looks at the difference between precipitation and evaporation. But since evaporation rates are hard to determine, it uses temperature as a proxy, on the assumption that evaporation rises as it gets hotter.Sheffield points out that temperature is only one factor influencing evaporation. He inferred evaporation rates using the Penman-Monteith equation, which includes factors such as wind speed and humidity, and found “little change in global drought over the past 60 years” (Nature, DOI: 10.1038/nature11575). His new calculations back up his own previous analysis that the most significant of recent droughts mostly occurred in the 1950s and 60s, before global warming got going. (From Link between global warming and drought questioned, New Scientist.)
Hurricanes
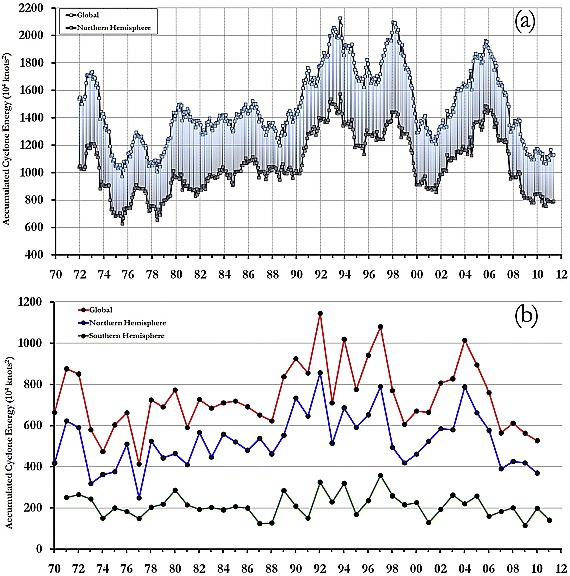
According to a study dating from 2011, by Ryan Maue,
In the pentad since 2006, Northern Hemisphere and global tropical cyclone ACE [accumulated cyclone energy] has decreased dramatically to the lowest levels since the late 1970s. Additionally, the global frequency of tropical cyclones has reached a historical low.Figure 1 from this paper, as published in Geophysical Research Letters, charts the history of ACE worldwide from 1972 through 2011:
What's happened since? According to a September 2017 article in the Washington Post, "Before Hurricane Harvey, the continental United States had not been hit by a Category 3 or higher “major hurricane” for 12 years — dating all the way back to 2005’s Hurricane Wilma."
----------------------------
Tornadoes

Strong to violent tornadoes 1950-2011, based on data from NOAA. Can you see a trend? I can't.
------------------------------------------------
Bottom Line
As we've seen, there is no real evidence for any trend involving heat waves, droughts, hurricanes or tornadoes. If you're enterprising you might be able to dig up more promising signs of increasing trends for extreme rainfall, floods, etc. And I feel sure you could find studies challenging many, if not all, the results I've presented above.
Regardless, even if all the data indicated increasing trends for all types of extreme weather, there would be no reason to link any of that activity to CO2, emanating from fossil fuels or any other source. The world has gotten warmer, no one questions that. There was a significant runup in global temperatures from 1910 to 1940, followed, 40 years later, by another significant rise during the last 20 years of the previous century. CO2 emissions, as we've learned, were too low to have much of an effect on the earlier runup, and as we've also learned, there is little hard evidence that CO2 had much to do with the latter one either. All we know is that things have gotten warmer -- if ticks are headed north, if polar bears are finding it hard to hunt for baby seals, if "rain bombs" are becoming more frequent, if polar ice is in danger of disappearing, etc., etc., it's because of the increased heat, period. Whether CO2 had anything to do with that is another issue entirely. Yet whenever "climate change" or "global warming" is mentioned, not only in the popular media, but many "scientific" papers as well, the deleterious effects of human generated CO2 are simply taken for granted. In the public mind, therefore, any sign of an increase in the frequency of any extreme event that could possibly be linked to rising temperatures MUST be the fault of everyone's favorite scapegoat: CO2.
.


No comments:
Post a Comment