Tuesday, November 2, 2021

Thoughts on Climate Change - Part 12: What is driving sea level rise?

According to this graph, based on evidence compiled by the Hadley Center, NASA and NOAA, we see little to no sign of global temperature rise from 1850 through 1910, a period of 60 years: 


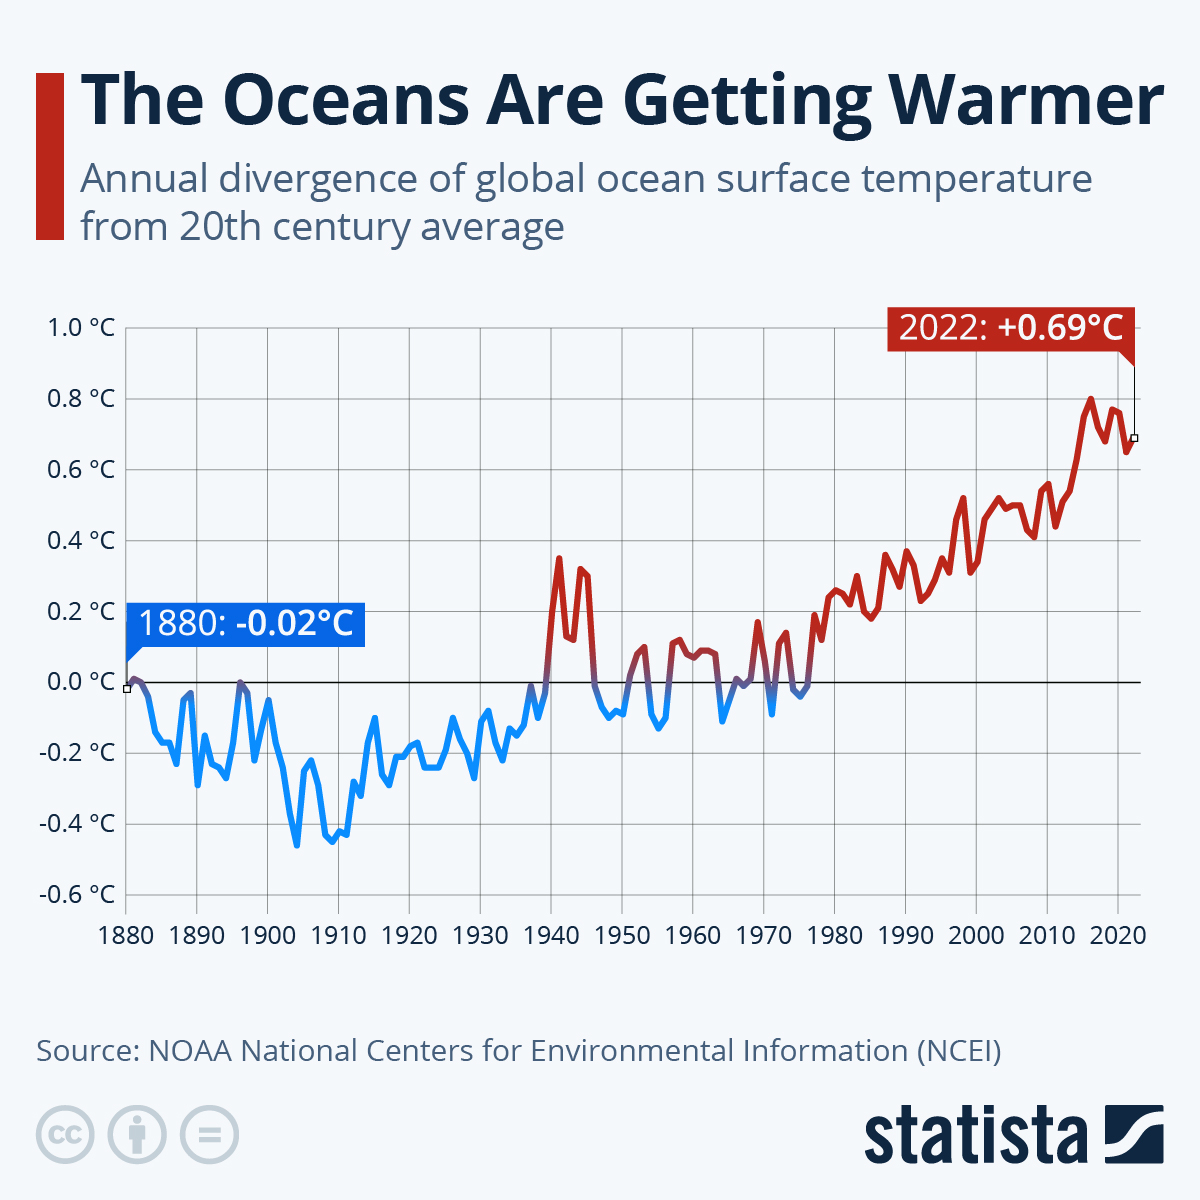
Oceanic temperatures also did not begin to rise until roughly the same time:


Yet sea levels began to rise steadily from at least 1880 and probably sooner: 


Thursday, May 13, 2021

Thoughts on Climate Change -- Part 11:Tamino's Trick

The "hiatus" -- the period from roughly 1998 to 2015, in which the steady rise of global temperatures, so strongly evident during the latter part of the 20th century, appears to have leveled off, contrary to the expectations of "climate change" advocates, who've been trying desperately to explain it away for many years. At least 66 different explanations for the hiatus were published by 2014 and many more have been offered since. My own personal favorite was proposed by blogger "Tamino" back in 2014 (updated in 2018):

Sunday, March 7, 2021

Thoughts on Climate Change -- Part 10: The Aerosol Excuse

Climate change advocates have been exceptionally ingenious in devising various ways to “cook” the raw data in such a manner as to fit their favored theory despite evidence to the contrary. For example, a common attempt to explain away the mid-twentieth century temperature hiatus is the frequently stated claim that an underlying warming trend was masked by industrial aerosols (i.e. pollutants) emitted, ironically enough, by the same process that also emitted large amounts of CO2.

Wednesday, May 15, 2019

Thoughts on Climate Change -- part 9: Even Worse Than We Thought!

Latest climate change bombshell: Canada has been warming twice as fast as the rest of the world. If you don't believe me, Google it.

Yes indeed. Just one report out of many, from the BBC itself,
Canada warming twice as fast as the rest of the world, report says 
Canada is warming on average at a rate twice as fast as the rest of the world, a new scientific report indicates.
The federal government climate report also warns that changes are already evident in many parts of the country and are projected to intensify.
But wait. As we're reminded time after time by climate scientists, the situation is actually MUCH WORSE. Because China is also warming twice as fast:

Monday, October 22, 2018

Thoughts on Climate Change -- part 8: A Tale of Two Graphs


I will set before you two different graphs representing the relation between CO2 levels and global temperatures: number 1:

Global temperature vs. CO2 concentration


[added 12-22-18]: Since the graph presented above tells us little about 21st century temperatures, I've decided to add this one, which represents the so-called "hiatus" from 1998 through 2015 much more clearly. (The spike we see for 2016 is due to an especially strong El Nino and does not reflect long-term temperature trends):


number 2:


(from a blog post titled  Does CO2 correlate with temperature? by one Robert Grumbine.)

When I "eyeball" the first graph it seems evident, as I've contended in the past, that there is NO correlation between CO2 levels and global temps. during the entire 100 year period between 1880 and 1980. Nor do I see any sign of correlation between  1998 and the present. I DO see a correlation between ca. 1980 and 1998, but that represents only 20 years out of the last 138.

Graph number 2, a scattergram in which CO2 levels are plotted directly against temperatures, presents a radically different picture, where the two appear to be very strongly correlated. How is this possible?

(According to Grumbine "It's awfully hard to look at this and say that there's no correlation between CO2 and temperature.")

I scratched my head over this for some time before I realized that the two graphs represent more or less the same relationship, only presented in very different ways. Only when we attach dates to that second graph does it become possible to see that both are essentially the same, only with the time scale distorted in the second. After all, while graph no. 2 is a scattergram and graph no. 1 is not, essentially the same set of temperature data is represented in the vertical axis of both. For example, the year 1940, when temperatures peaked after a long increase, corresponds roughly with a CO2 level of 310 parts per million, as represented in graph no. 2, which shows temperature peaking at the same point; the year 1980, when temperatures began to rise dramatically, corresponds roughly with a CO2 level of 335 ppm. where the temperature begins to rise in graph no. 2 as well.

No sooner do we begin to recognize the relationship between the two graphs does it become apparent that there is in fact NO correlation in graph no. 2 until it gets close to the 335 level, around 1980. Similarly, we see no correlation after 370 ppm, the level reached around 1998, the beginning of the well-known "hiatus," as represented in graph no. 1.

The reason graph no. 2 appears to depict a correlation is due to the time distortion produced by the fact that CO2 levels shot up so rapidly from ca. 1980 to ca. 1998. [Correction: the previous phrase should read: "temperatures shot up so rapidly from ca. 1980 to ca. 1998."] Thus, unlike graph no. 1, which presents a more or less accurate picture of climate history since 1880, graph no. 2 distorts that history to emphasize the relatively brief 20 year period when both CO2 levels and temperatures were increasing at the same time.


When both graphs are examined critically it becomes clear that there is no evidence whatsoever of a correlation between CO2 levels and global temperatures, aside from the brief 20 year period at the end of the previous century, which all but rules out the possibility of a causal relationship, thus placing the entire human-caused "climate change" meme in serious doubt. 

Anyone following the analysis presented above should better understand why I'm so skeptical when it comes to the excessive reliance on statistical methodologies when attempting to evaluate scientific evidence. As a wise man once said, "If you torture the data long enough it will confess to anything."

Sunday, May 27, 2018

Thoughts on Climate Change -- part 7: The Climate Science Mystique

When I was in high school some of my favorite classes were science classes: biology, general science, physics, chemistry, etc. And I did really well in all of them. As far as math is concerned, I aced every single class, with a perfect score in each final exam, including the NY State Regents exams. If I hadn't fallen in love head over heels with music, I might well have decided to become a scientist of some sort: a physicist, mathematician, biologist, chemist, astronomer, etc. It never would have occurred to me in a million years, however, to become a climate scientist -- that was simply off my radar. Nor can I imagine any young person of my generation with both a serious interest in science and a real aptitude for it hankering to pursue a career in climate science. Maybe it's just me, but the prospect of doing that sort of research just seems too utterly boring for words.

Thursday, May 24, 2018

Thoughts on Climate Change -- part 6: Let Me Count the Ways

This post is going to be very simple, but also, I'm afraid, rather devastating. What follows is a list of some of the most serious problems with the mainstream "climate change" paradigm and some of the many attempts to shore it up. I won't attempt to argue any of these points in any detail, as they have already been argued at length either on this blog or elsewhere, but simply present them in as succinct a manner as possible.

Saturday, May 12, 2018

Thoughts on Climate Change -- part 5:Still more "saving hypotheses"

Still more "saving hypotheses" on  the part of true believers.

But first a brief summary of claims I've already debunked:

1. The mid-twentieth century hiatus in global temperatures can be explained by the cooling efffect of industrial aerosols (see the second post in this series).

2. Sea level rise isn't correlated with CO2 emissions, because, according to blogger CCHolley, it's "highly variable about the mean level due to the hydrological cycle," and besides "sea level rise correlating to temperatures has nothing to do with the cause of the temperature rise," and besides "perfect correlation to temperature would not be expected because ice will not stop melting just because warming stopped, it takes time for the ice to reach thermal equilibrium. . ." -- none of which has the slightest bearing on  the fact that it's impossible to claim a cause-effect relation if no correlation exists, for whatever reason (see also the third post in this series.)

3. Evidence that sea level rise has actually declined over the last several years can be explained by the cooling effects of the Mt. Pinatubo eruption, which masked the expected accelaration (see the previous post in this series).

Now for some more examples:

 
Add to Technorati Favorites